Google Search Console Generative AI Report: How Impressions Are Counted
Google’s Generative AI report is available worldwide. Learn how AI Overview and AI Mode impressions are counted, aggregated, and commonly misread.
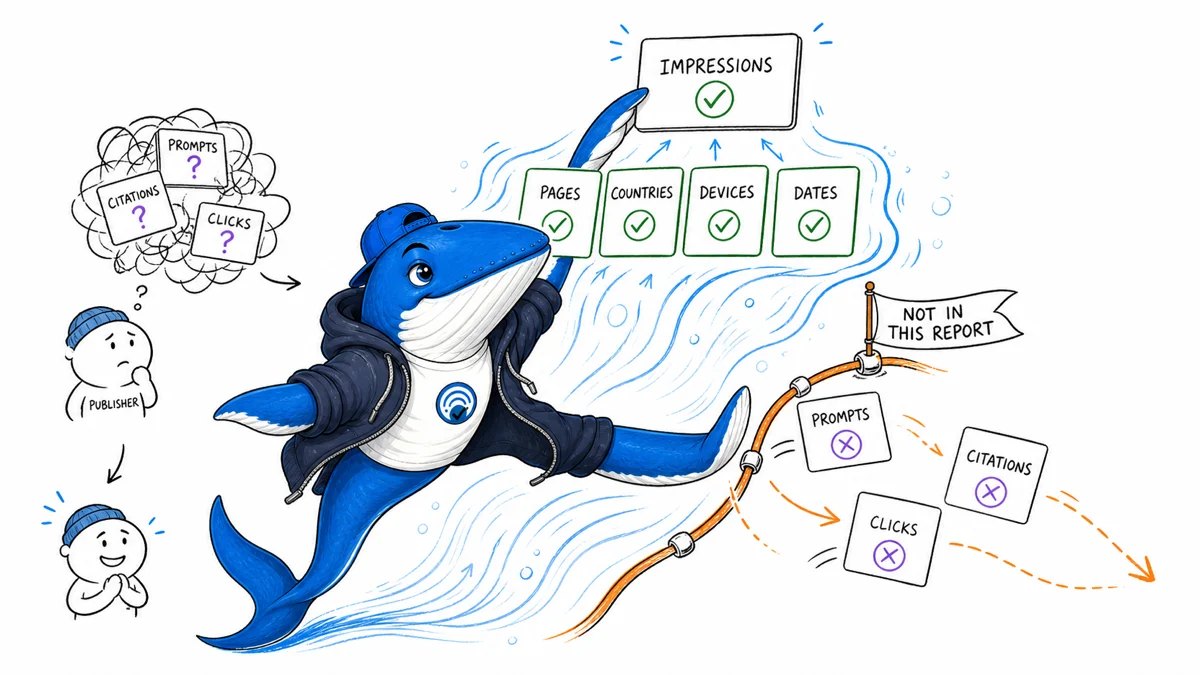
Direct answer: Google Search Console’s Generative AI performance report shows when links from a verified property received impressions in AI Overviews or AI Mode. It can group those impressions by page, country, device, and date. It does not expose the user’s prompt, a citation count, a dedicated click total, visits, conversions, or the reason Google selected a page.
That makes the report useful, but only when it is read as a visibility report. It can show where an observation occurred and how that observation changed over time. It cannot turn a line-chart spike into an optimization verdict.
What the screenshot establishes
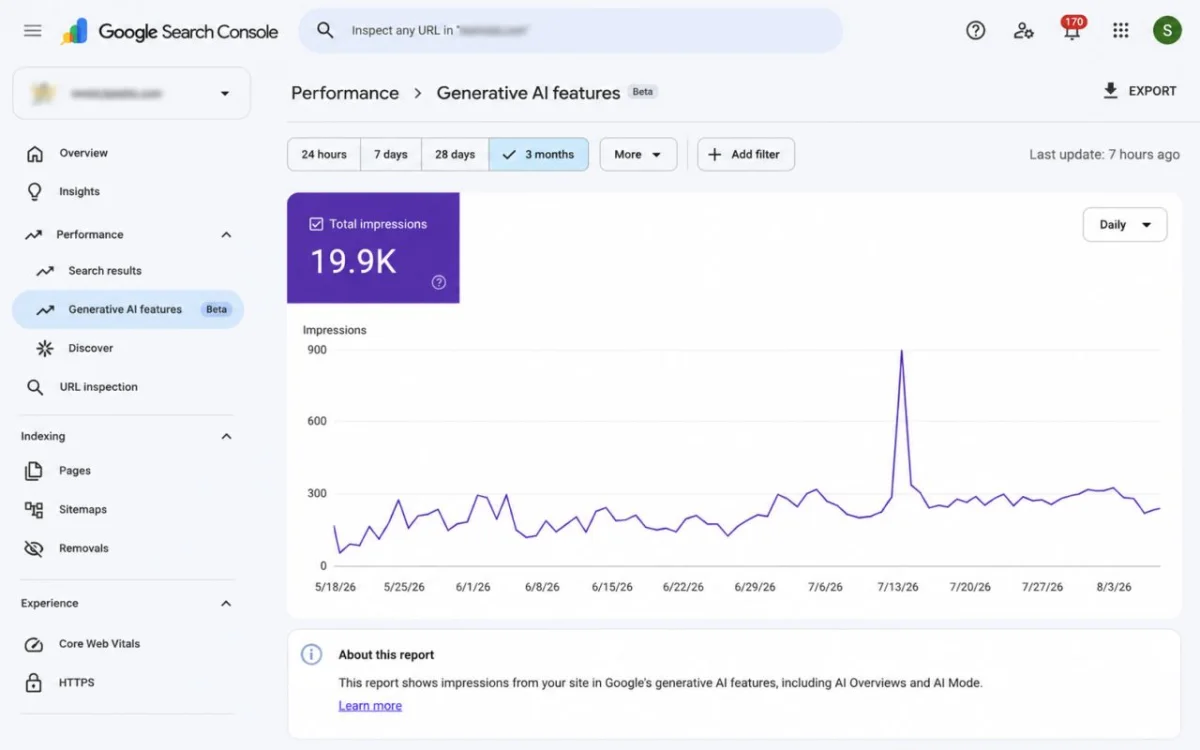
The screenshot shows a property with 19.9K reported impressions over the selected three-month period, a daily trend line, and a sharp spike around mid-July. It also shows the report marked as beta and describes its scope as impressions from Google’s generative AI features, including AI Overviews and AI Mode.
It does not show which prompts produced those impressions, which pages contributed most, whether anyone clicked, or what caused the spike. One property screenshot is a useful field observation, not a representative benchmark for other sites. The correct next move is to open the page, country, device, and date dimensions and preserve the same report settings before interpreting the pattern.
What Google added
Google announced dedicated generative AI performance reports on June 3, 2026. The Search report covers AI Overviews and AI Mode, while Search Labs experiments are excluded. Google added a note saying the insights reached all websites worldwide on August 31, 2026. The same help page still retains troubleshooting text saying a missing report may reflect access rollout, too few eligible impressions, or exclusion from generative AI features. Treat the worldwide note as the current availability statement and the residual troubleshooting list as possible reasons a specific property still has no usable report.
The data is not a new traffic pool. Google says generative AI impressions were already included in the broader Web search-type totals. The dedicated view isolates that subset so publishers can examine it. Adding the Generative AI total to the Web total would double-count the same observations.
How Google counts a generative AI impression
An impression does not mean that a reader visited the site, read the source, or remembered the brand. Google applies its standard Search Console impression rules to AI Overviews and AI Mode. A link in the current result set can count even when it is below the browser viewport, provided the user does not have to click to reveal more results. A link hidden behind an expansion such as “Show more” generally needs that expansion before it can receive an impression.
| State | What happened | Can this report establish it? |
|---|---|---|
| Feature served | An AI Overview or AI Mode response appeared for a search | No when the site was absent, because site-level data contains no feature-served denominator |
| Site included | The response contained one or more links to the property | Only when a link met Google’s impression rule |
| Link immediately revealable | The link was in the current result set without another click | Yes, it can count without browser viewport scrolling under the standard rule |
| Link behind expansion | The user had to expand a result element to reveal the link | Normally only after the expansion |
| Outbound click | The user followed a link outside Google | Not as a dedicated metric in this report |
| Measured visit | The site received and recorded the arrival | No, use server, CDN, or analytics evidence |
AI Mode follow-up questions are treated as new queries. For AI Overviews, the entire overview occupies one Search position and every link inside it receives that same position. Citation order inside the overview is therefore not a position ranking.
The property chart and page table can legitimately disagree. When several links from one site appear in one generative result, the property chart can aggregate them into one site impression while page grouping records the eligible canonical pages separately. Search Console assigns most data to Google’s selected canonical URL, uses Pacific Time for dates, can revise preliminary values, and applies its usual privacy and row limits.
The most important missing value is the negative denominator. When this property records no impression, its own export cannot tell whether no generative feature appeared, the feature appeared without the site, the site was present behind an unopened expansion, or the observation was withheld. Do not calculate an inclusion rate unless a separate test captures the total number of eligible feature appearances.
What can you actually learn from the report?
| Question | Evidence to inspect | Safe conclusion | What remains missing |
|---|---|---|---|
| Which pages are appearing? | Page dimension for a fixed period | These canonical pages received reported generative AI impressions | Prompt, citation context, click, and selection reason |
| Which topics are visible? | Publisher-created groups of the reported pages | Visibility is concentrated in these editorial page groups | Google does not provide a query or topic dimension in this report |
| Is visibility changing? | Daily or weekly trend with identical filters | Reported impressions rose, fell, or spiked in the selected period | The chart alone does not identify the cause |
| Where is visibility occurring? | Country and device dimensions | The reported mix differs by these dimensions | Audience intent, satisfaction, and commercial value |
| Did AI visibility create traffic? | Search Console plus analytics and landing-page evidence | Only a bounded association when dates and pages align | A dedicated click metric and causal attribution |
The missing query dimension is especially important. You can group visible pages into your own editorial topics, but that is a publisher-created analysis, not evidence that Google exposed a particular topic label or prompt. Keep that distinction in the worksheet and in any report shared with clients or editors.
A repeatable monitoring workflow
- Freeze the report state. Record the property, Search or Discover surface, date range, search type, filters, dimensions, time granularity, timezone, and export time.
- Save an unfiltered baseline. Export the longest useful period before changing controls. Retain the screenshot and exported file together.
- Find page concentration. Rank canonical pages by impressions and calculate how much of the visible total sits in the leading group.
- Create editorial page groups. Map the pages to real site categories or reader jobs. Label this as your taxonomy, not Google’s.
- Compare one dimension at a time. Hold the period and filters constant while checking page, country, device, or date. Changing several controls together makes the difference difficult to interpret.
- Annotate the timeline. Add publication dates, material updates, template releases, migrations, manual actions, indexing incidents, seasonal events, and external news that could explain a change.
- Pair visibility with the right outcome layer. Use the broader Search performance report and analytics for clicks, sessions, engagement, subscriptions, or revenue. The AI impressions versus traffic guide explains why those layers should remain separate.
- Declare a recheck rule. Review weekly during rollout or after a material release, otherwise monthly. Investigate a spike only when it survives preliminary-data changes and exceeds a threshold set before looking at the chart.
When exporting, preserve the interface context. Google notes that a tilde or dash shown for a low or withheld value can become zero in a download. A downloaded zero may therefore mean “not disclosed,” not a precise observation of no impressions.
Do not turn the report into another AI SEO checklist
The report does not publish a new ranking system, reveal prompts, or identify a special markup that earns inclusion. Google’s current guidance says there are no additional technical requirements or special schema for AI Overviews or AI Mode. A page still needs ordinary Search eligibility, crawlable content, snippet eligibility, useful information, and the same technical and editorial foundations that apply elsewhere in Search.
Use the report to choose where to investigate. If a cluster of original guides begins receiving impressions, inspect what those pages have in common, preserve the observation window, and test one material change at a time. If impressions fall, check access, index state, canonical changes, page availability, report filters, and external demand before blaming an algorithm. The AI visibility measurement crosswalk can help map each question to the evidence that can answer it.
The strongest conclusion the report supports is modest but useful: a known set of canonical pages received a reported amount of visibility in Google’s generative AI features during a defined period. Everything beyond that requires another evidence layer.
Known versus inferred
Treat a Generative AI report as a reporting surface, not a ranking blueprint
The report can show what Google exposes for the verified property. It cannot, by itself, explain why a page was selected, cited or omitted from an AI feature.
- Preserve the report’s exact labels and date range.
- Compare page and query movements with standard Search Console data.
- Document filters and property scope before sharing screenshots.
- Mark causal explanations as hypotheses until another source supports them.
My takeaway: My recommendation is to use the report for prioritization and monitoring, then inspect the affected URLs. A new chart does not remove the need for page-level evidence.
Primary documentation
- Google Search Central: Introducing generative AI performance reports in Search Console
- Search Console Help: Generative AI performance report
- Search Console Help: How clicks, impressions, and position are counted
- Google Search Central: AI features and your website
Screenshot source and credit: Swetha G R. The screenshot is treated as a practitioner field observation; Google’s documentation remains the authority for report behavior and counting rules.
Keep learning
Continue this topic
Next in this topic
Search, Agent and Training Bots: A Practical Access Policy for Publishers
Earlier in this topic
How to make content easier to cite in AI search
AEO & AI Search
Ask a question or join the discussion