
What a revised clickstream study says about ChatGPT referrals
The revised US desktop study measures referrals per ChatGPT session and per Google query. The two units answer different questions.
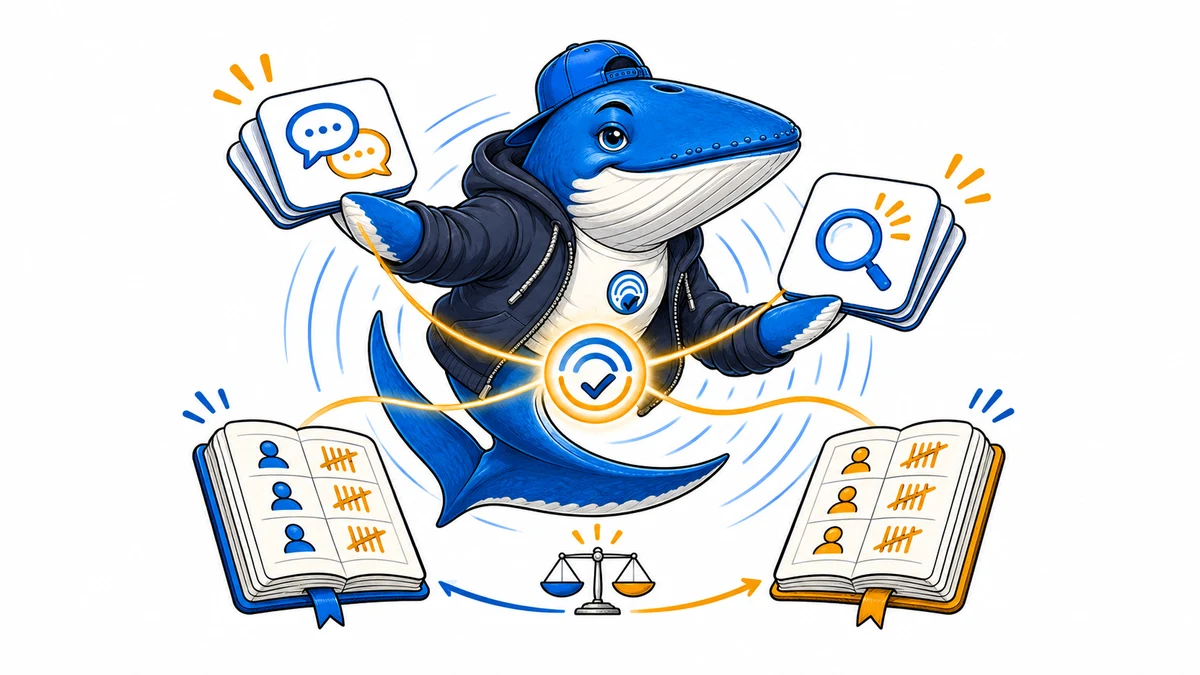
A preprint revised on November 12 reports that referrals accompanied 5.4% of ChatGPT sessions and 31.1% of Google queries in historical US desktop clickstream data. The July version reported 5.2% for ChatGPT conversation sessions. These are two versions of a study, so the numerical revision cannot be read as growth between July and November. July preprint · November revision
A session and a query measure different things
A ChatGPT session can contain several turns. A Google query is one search event. The revised paper measures whether a referral accompanies each event under the authors’ rules. Comparing the percentages describes referral behavior in those two units. Dividing one percentage by the other cannot tell a publisher how many visits a Google query would deliver if that same task moved to ChatGPT.
The revised abstract also distinguishes people who adopted ChatGPT from people who were already using it when no-login Search access expanded. Among existing users, the expansion increased ChatGPT use. The authors found no detectable overall change in conventional searches for that group, though searches fell among households with lower prior search activity. That distinction is more useful than applying one displacement percentage to every audience.
Keep publisher measurements tied to the landing page
Use the paper to frame a question about your own audience, then compare attributable referrals by landing-page type. Label the date range, attribution rules, and platforms in the report. Record traffic separately from citation checks because a visible citation can produce zero visits in an observed reporting period. For implementation, see the GA4 referral guide.
The study is a preprint based on a historical US desktop sample. It does not measure current global or mobile traffic shares.
How the study constructs a ChatGPT session
The revised paper groups repeated loads of the same conversation for a household. In the main analysis, a gap longer than one hour starts a new session. The authors also tested a 30-minute rule, which produced about 4.9% more sessions than the main rule. They report that the monthly referral incidence changed little under the alternatives they plotted. The session boundary matters because changing it changes how many opportunities form the denominator. Methods and online appendix
The study uses Comscore US desktop activity from October 2024 through July 2025. The balanced panel of 45,386 households is used for the conventional-search analysis. The descriptive referral analysis uses its own sample and counts activity events. Keep those two samples distinct when quoting the paper.
What the percentages would mean per 1,000 observations
Applied to hypothetical sets of 1,000 events, the revised percentages correspond to about 54 ChatGPT sessions with a referral and 311 Google queries with a referral. This rescaling makes the units visible. In this comparison, a session that generates several external visits still counts as one session with a referral. The example cannot estimate the total visits either platform sent to a particular site.
The authors also report a different mix of destinations. In the sample, reference and technical sites received a larger share of ChatGPT referrals than Google referrals, while ad-supported sites received a smaller share. A distribution of destinations answers which kinds of sites received the observed traffic. For your own publication, compare landing-page groups such as guides, tools, and news over the same period and retain the raw referral counts alongside their shares.
Keep learning
Continue this topic
Measure referrals
Set up the GA4 investigation
Check definitions
Keep each visibility event separate
Test the score
Compare visibility with actual visits
Research
Ask a question or join the discussion