How to Validate AI Visibility Scores Against Referral Traffic
Match AI-visibility scores to referral sessions by page, platform, date, coverage and lag before calculating correlation or making a traffic claim.
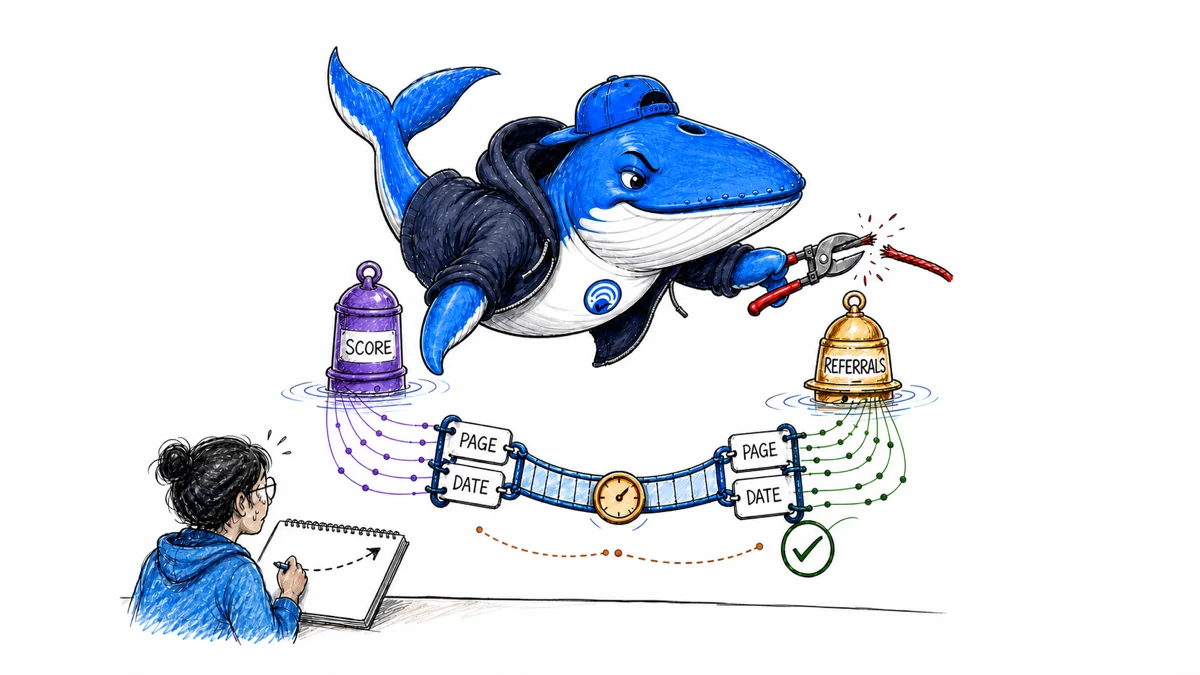
Direct answer: an AI-visibility score can be compared with referral traffic only after both datasets share a time grain, platform scope, and canonical page key. Even then, an association is a diagnostic result, not proof that visibility caused visits.
This guide replaces an unfinished 30-day experiment with a reusable validation method. Use the browser-local lag auditor to check coverage and rank correlation across declared lags, then preserve the evidence contract in the 36-field validation ledger. The included rows are examples marked EXAMPLE-REMOVE, not SearchEngineAnswer findings.
Decide what the score must predict
Start with one falsifiable question. A workable version is: “For this frozen set of canonical pages and this named AI platform, do higher daily visibility scores align with more qualifying referral sessions at lag zero through seven days?” This is narrower than asking whether an AEO program “worked.”
The unit of analysis is one canonical page, platform, and observation date. Do not join a sitewide weekly score to page-level daily sessions and then describe the rows as paired. If the vendor supplies only an aggregate brand score, the outcome must use the same aggregate scope or the analysis must stop.
| Layer | Observable field | What it cannot establish alone |
|---|---|---|
| Vendor visibility | Score, mention, citation, prompt sample, platform and date | That a real user saw the answer or clicked |
| Platform citation | Cited page, grouped query, citation count or share | Ranking, authority, traffic or page influence |
| Referral visit | Session source, medium, landing page and consent state | Every zero-click mention or citation |
| Server arrival | Request time, landing path, referrer and response | A human session, engagement or conversion |
| Business outcome | Qualified signup, lead, sale or declared event | Which prior answer or citation caused it |
Copy the score contract before exporting data
“AI visibility” is not one standard metric. A vendor may combine topic coverage and mention consistency, track a frozen prompt list, count cited pages, or estimate audience from a proprietary prompt database. Copy the current definition, scale, sample source, platform coverage, country, refresh cadence, denominator, and aggregation before collecting the first row.
For example, Semrush documents its 0–100 AI Visibility score as a combination of topic coverage and mention consistency. Its separate prompt-tracking product runs selected prompts by platform and location. Those are related but different datasets; neither should silently replace the other during a test.
Bing AI Performance supplies a useful platform-owned contrast. Microsoft says its citations, cited pages and grounding-query data are aggregated and incomplete, and explicitly says they do not represent traffic, ranking, authority, importance or a page’s role in an individual answer. A vendor score built from mentions cannot be treated as the same event as Bing’s page-level citation count.
Build the referral contract separately
In Google Analytics, source and medium describe where a session originated, while landing page identifies the first page in that session. Use session-scoped acquisition fields for a session outcome. Do not mix them with first-user acquisition or event attribution and call the result “referral traffic.” Google’s traffic-source documentation explains the source, medium and UTM inputs.
Define the included AI sources before looking at the result. OpenAI currently documents that ChatGPT referral URLs include utm_source=chatgpt.com. That field can help classify inbound sessions, but it does not enumerate every ChatGPT mention, citation or click path. Other platforms may expose a referrer, a UTM value, neither, or a value changed by redirects and privacy controls.
Preserve (not set), direct, unassigned and missing landing pages as measurement states. Google documents that a missing session_start can produce (not set) for session source/medium and that a session without page_view can produce a missing landing page. Deleting those rows can make a sparse relationship look cleaner than the collection was.
Normalize pages before you join the files
Resolve every vendor URL and analytics landing page to the canonical URL used by the study. Remove ordinary campaign parameters, normalize the hostname and trailing-slash policy, and retain a separate raw URL field. Do not merge distinct localized, paginated or product-variant pages merely because their paths look similar.
A page match is valid only when the score observation and the referral arrival point to the same declared page unit. A domain citation paired with any visit to the domain is a site-level comparison, not page-matched evidence.
| Join field | Accept when | Stop when |
|---|---|---|
| Date | Both sources use the same time zone and daily boundary | A weekly score is copied into seven daily rows |
| Platform | The score and referral rule name the same product surface | Several engines are pooled into “AI” |
| Page | Raw URLs resolve to the declared canonical unit | A domain mention is assigned to one landing page |
| Prompt cohort | Membership and wording remain frozen for the window | The vendor sample changes without a new version |
| Observation state | Observed zero and missing collection are distinct | Blank, error and zero become the same value |
Measure coverage before correlation
Create the expected observation grid before importing values. If the declared design covers 10 pages, two platforms and 28 days, it contains 560 page-platform-day cells. Count complete, observed-zero, missing, excluded and vendor-error cells against that denominator.
Set a coverage gate before analysis. A practical starting rule is to withhold a correlation when fewer than 20 complete pairs exist in a group, when less than 80% of expected cells are usable, or when one series never changes. These are diagnostic safeguards, not universal statistical thresholds.
Keep zeros. A score of zero and zero qualifying sessions is an observed pair. A missing score, unavailable export, blocked analytics event or unresolved landing page is not zero. The downloadable ledger has separate fields for coverage status and exclusion reason so a reviewer can reconstruct that decision.
Illustrative gate: suppose one page-platform group should contain 28 daily rows. Twenty-two rows have a score and a qualifying session count, three are observed zeros in both series, two lack a vendor export, and one has an unresolved landing page. The usable numerator is 25, not 28 and not 22, because observed zeros are data while the three missing or unresolved cells are not. Coverage is therefore 25 divided by 28, or 89.3%. The group clears an 80% coverage rule and a 20-pair rule, but it still stops if either usable series has no variation.
Publish that arithmetic beside the coefficient. A reader should be able to recover the expected denominator, usable numerator, zero count and each exclusion without guessing which blanks were silently discarded. If expected rows were never constructed, “coverage” is only completeness relative to the rows that happened to arrive.
Declare the lag grid before looking for a peak
A referral may occur on the same day as an answer observation or later. Choose the lag window from the reader journey and collection cadence, not from the most flattering chart. The companion auditor evaluates zero through seven days by default and reports the number of complete pairs at every lag.
Each added lag is another comparison. A peak at day five can occur by chance, especially with sparse traffic and autocorrelated time series. Publish the full lag table, identify the predeclared primary lag, and label the rest sensitivity checks. Do not report only the largest coefficient.
Close an observation period when the vendor changes its score definition, prompt database, platform mix or refresh schedule. Start a new version rather than combining incompatible contracts across the change.
Compute rank correlation only after the data gates pass
Spearman rank correlation is useful when the question is whether higher values in one series tend to accompany higher values in another without assuming a linear scale. It still needs variation and enough paired observations. Tied values are common when sessions are mostly zero, so the auditor assigns average ranks before calculating the coefficient.
Report the coefficient with the pair count, coverage, zero counts and lag. The browser tool intentionally does not produce a p-value or causal verdict. A coefficient without the collection contract can hide one high-traffic page, a shared demand spike, a vendor sample change or a tracking repair.
Review page-level groups before pooling. If one page has stable high traffic and another has volatile score movement, a sitewide coefficient can describe page mix rather than within-page alignment.
Interpret four outcomes without forcing a win
| Observed pattern | Safe interpretation | Next check |
|---|---|---|
| Score and referrals move together | They are associated in this declared group and lag | Check demand, campaigns, page mix and platform changes |
| Score rises; referrals do not | The score may describe exposure without visits, or the join may miss clicks | Inspect cited pages, source rules and zero-click behavior |
| Referrals rise; score does not | Traffic may come from prompts, pages or platforms outside the monitored sample | Audit referral landing pages and sample recall |
| Neither series varies enough | The window cannot test the relationship | Extend collection or narrow the claim |
Use the AI visibility measurement crosswalk to keep exposure, citation, referral and conversion fields separate. The GA4 referral workflow covers acquisition-field checks, while the platform-tailwind guide explains why a shared demand rise can mimic intervention lift.
Run the browser-local lag auditor
- Export the selected vendor metric and qualifying referral sessions without deleting zeros.
- Normalize each row to
date,canonical_url,platform,visibility_score,referral_sessionsandcoverage_status. - Open the AI visibility/referral lag auditor. It runs entirely in the browser and makes no network request.
- Paste CSV data, set the maximum lag and coverage gate, then inspect the stop conditions before reading a coefficient.
- Export the lag diagnostics and retain them beside the source files and the validation ledger.
The tool does not upload data, save it to browser storage, identify AI traffic, or prove causation. Remove confidential prompts, user identifiers, raw IP addresses, tokens and internal URLs before using a public browser tool. The example rows exist only to demonstrate the file shape.
Publish the contract beside the result
A defensible report names the vendor metric version, platform, country, account state, prompt cohort, page scope, time zone, expected grid, coverage, exclusions, referral rule, canonical rule, lag grid, primary lag, correlations, confounders and stopping decision. Attach the complete lag table, not only the strongest row.
Record product releases, site launches, campaigns, tracking changes, consent changes, outages and news demand during the window. If one could move both series, it belongs beside the result as an alternative explanation.
Use a visibility score as a research proxy when it helps prioritize pages or questions. Do not use it as a traffic forecast until the same score contract repeatedly survives page-matched validation. The SEO and GEO score-evaluation guide provides a separate procurement check for metric definitions, exports and decision utility.
Sources, method and limits
Sources: Semrush’s current AI Visibility data definition; Microsoft’s Bing AI Performance documentation; Google Analytics traffic-source and missing-value documentation; and OpenAI’s publishers and developers FAQ. Each source is linked beside the claim it supports and was retrieved on September 1, 2026.
Method: SearchEngineAnswer separated score, citation, session, server and outcome contracts; defined a canonical page-platform-date join; implemented coverage gates and average-rank Spearman diagnostics across declared lags; and packaged the fields in a removable-example ledger.
Limits: SearchEngineAnswer did not run the original 30-day study and reports no observed relationship. The tool provides descriptive diagnostics, not inferential statistics, attribution or causal identification. Vendor samples, AI answers, tracking, consent, redirects, demand and platform behavior can change. A useful result is bounded to the named data contract and window.
Keep learning
Continue this topic
Next in this topic
ChatGPT Conversion-Optimized Campaigns Still Charge Per Click
Earlier in this topic
Citation Wars: Can GEO Optimization Make Content Worse?
AEO & AI Search
Ask a question or join the discussion