Google AI Mode Cut Publisher Click-Through by 18.8 Points in a Field Experiment
A field experiment found AI Mode assignment reduced publisher click-through by 18.8 points. Separate ITT, LATE, limits and site-specific measurement.
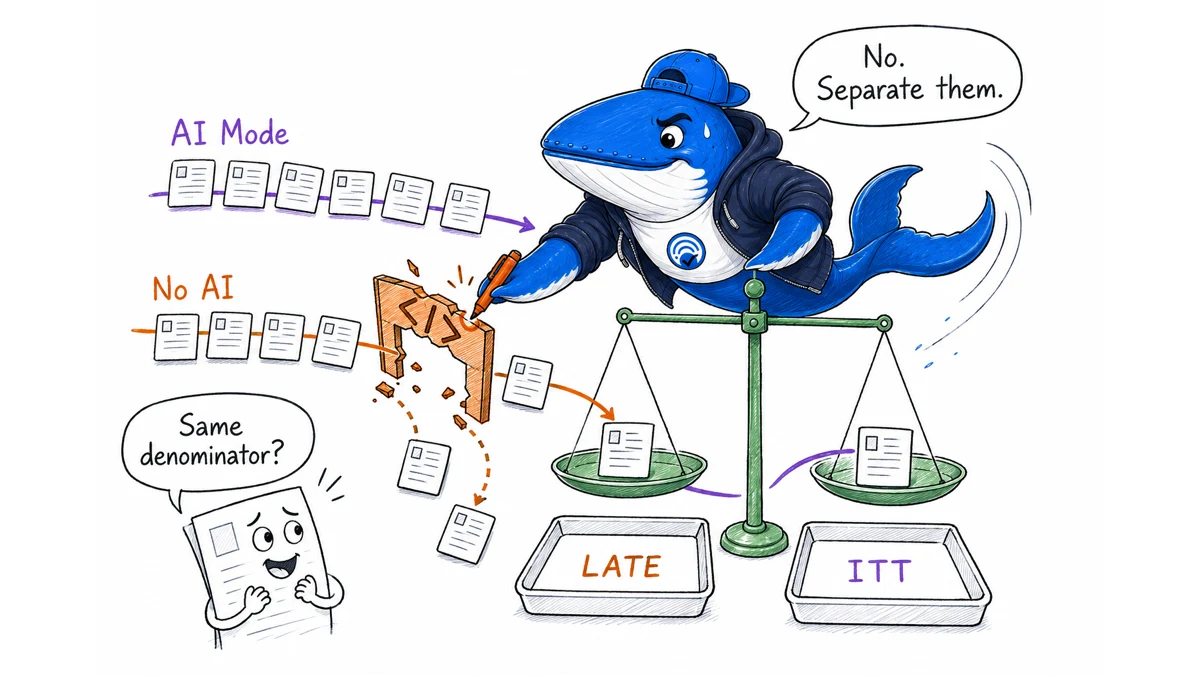
Direct answer: A preregistered US field experiment found that assignment to Google AI Mode reduced publisher click-through by 18.8 percentage points compared with current Search during the study. That is a treatment effect in one seven-day experiment, not evidence that every site lost 18.8% of traffic. The distinction matters: percentage points are not percent, assignment is not universal adoption, and the March 2026 interface is not a permanent product state.
The study is unusually useful because it observed browsing behavior outside a lab. It is also a preprint with a specific sample and intervention. Publishers should use it to improve measurement design; not to paste one number into a traffic forecast.
How the field experiment worked
The researchers recruited US adults who primarily used Chrome and Google. Recruitment ran March 17–19, 2026. Participants completed a three-day baseline period, then spent seven days in one of three randomized conditions: current Search, an AI Mode experience, or a “No AI” condition designed to hide AI results.
The paper reports 1,444 enrolled participants, 1,100 in the browser-behavior analysis, and 956 survey respondents. During baseline, AI Overviews appeared on 36% of observed searches while AI Mode use was only 0.6%. The AI Mode intervention successfully routed 94.7% of eligible searches. The No-AI intervention was less complete: across that condition, 51.1% of AI Overviews were hidden.
| Result type | Relevant population | Valid interpretation | Invalid shortcut |
|---|---|---|---|
| AI Mode assignment | Randomized analysis sample | Intent-to-treat effect of assignment | Effect on every person who intentionally chooses AI Mode |
| No-AI exposure | Users whose exposure changed because of the intervention | Local average treatment effect for compliers | Average effect of removing AI results for all users |
| Survey measures | Survey respondents | Self-reported treatment differences | Observed publisher revenue or population-wide sentiment |
The click result is large; but easy to misstate
Assignment to AI Mode reduced click-through to publishers by 18.8 percentage points relative to current Search (95% confidence interval: −22.2 to −15.3; p<.001). In the No-AI analysis, reduced exposure to AI results increased publisher click-through by 8.8 percentage points (95% confidence interval: 2.3 to 15.3; p=.008).
Those are not mirror-image estimates. The AI Mode result is based on randomized assignment and is reported as an intent-to-treat effect. Because the hiding intervention did not remove every AI Overview, the No-AI estimate uses the intervention as an instrument and applies to participants whose exposure was changed by it. Put “ITT” and “LATE” in the metric name rather than burying the distinction in a footnote.
The paper also reports 0.92 fewer search sessions per day under AI Mode. Click-share changes were −12.5 points for news, −21.2 points for Reddit, and −9.9 points for Wikipedia. Ad clicks fell 42.7 points, but AI Mode had no ads during the study; that result should not be projected onto a later ad-supported interface.
Fewer searches did not mean less information seeking
Participants assigned to AI Mode increased use of competing search engines by 11.2 percentage points. That suggests substitution, not simply disappearance. A publisher measurement plan therefore needs more than Google organic sessions: direct visits, referrals from other engines, branded demand, newsletter activity, and repeat visits can reveal where the journey moved.
The survey results add another caution. Trust declined by 0.34 on a seven-point scale, alongside reported declines in usefulness, satisfaction, agency, and personalization. These are self-reports captured in a short experiment. They do not prove lasting dislike, but they challenge the assumption that a more answer-complete interface automatically feels better to every user.
For a separate behavioral comparison, our 900-person AI Overview click study analysis explains how interface conditions can change where people click. The AI visibility and referral test shows how to keep answer appearance and attributable visits in separate columns.
Build a publisher denominator map before forecasting
Download the AI Mode study denominator map (CSV). Its rows are marked EXAMPLE-REMOVE. Replace them with the paper values you use and your own observations; do not present the template as an original SearchEngineAnswer experiment.
- Record the unit: query, search session, participant, click, or survey response.
- Record whether the number is a raw mean, percentage-point difference, percent change, ITT estimate, or LATE estimate.
- Preserve the comparison condition and time window.
- Separate an interface effect from adoption assumptions.
- Model traffic by query class and page type instead of applying one average to the whole site.
A defensible scenario might say, “If 20% of this query portfolio moves to an interface with the study’s treatment effect, and if our audience behaves like the experimental sample, the modeled click opportunity changes by X.” It should not say, “AI Mode cuts all SEO traffic by 18.8%.”
What publishers can change now
Prioritize pages where the visit itself carries value: interactive tools, original datasets, first-hand reporting, downloadable templates, comparisons with transparent methods, and content that answers the next question rather than merely restating the first one. A complete answer can reduce a shallow click; it cannot replace a useful workflow, a proprietary observation, or a reason to return.
Measure citation and referral separately. Save the prompt, surface, location, device, timestamp, cited URL, linked URL, landing session, and conversion event. Our AI Overview viewport test provides a compatible observation pattern. Do not infer a referral from a citation or infer a citation from an impression.
Finally, segment news and community-dependent pages. The study’s category shifts make those areas worth monitoring, but they are not site-specific forecasts. Use Search Console, analytics, server logs, and controlled answer checks to find your own change point.
Limits that belong next to the result
The paper is an August 2026 preprint and had not completed peer review when checked. Its participants were US adults, primary Chrome and Google users, and the sample skewed younger and more educated than the US population; 75% were under 45 and 87% reported at least some college. The political composition was also uneven, with 58% identifying as Democrats and 20% as Republicans.
The experiment lasted seven days after baseline and captured the March 2026 product. Interfaces, ads, routing, model behavior, and user familiarity can change. Novelty can also affect both behavior and survey responses. These limits do not erase the randomized result; they define where it can safely travel.
Source, method, and update note
Primary source: the researchers’ preregistered field-experiment preprint, checked September 3, 2026.
Method: SearchEngineAnswer extracted the experimental design, denominators, effect type, interval, sample constraints, and product-timing limits. We did not rerun the experiment and report no site-specific traffic estimate.
Recheck trigger: Update this article if the paper is peer reviewed, its sample or estimates change, or Google materially changes the AI Mode interface used for publisher links and ads.
Put click studies on a common denominator
The three supporting analyses use different surfaces, samples and denominators. They now accompany the field experiment so readers can compare measures without turning unrelated percentages into a single click-through claim.
| Change | What it affects | Best next check |
|---|---|---|
| AI Overview Click Study: What the 1% Means | A 900-person US browsing study observed fewer result clicks and more session endings when AI Overviews appeared. Here is the denominator, study design, and limit behind the 1% source-click figure. | The paper studied one month of desktop browsing from a representative panel of 900 US adults in March 2025. |
| ChatGPT Outbound Clicks: 5.2% Is Not CTR | A 2026 U.S. desktop study separates ChatGPT’s session-level outbound-click rate from an estimated 9.4% reduction in traditional search use. | It concerns reduced traditional search use after wider ChatGPT Search access. |
| AI Overview Click Studies: 1%, 15%, 39.8% | Three prominent 2026 findings use different samples, treatments and outcomes. Here is the denominator-safe comparison. | Keep unit, treatment, outcome and inference beside the number. |
Originally reported 2026-08-16
AI Overview Click Study: What the 1% Means
Why it matters: A 900-person US browsing study observed fewer result clicks and more session endings when AI Overviews appeared. Here is the denominator, study design, and limit behind the 1% source-click figure.
Next check: The paper studied one month of desktop browsing from a representative panel of 900 US adults in March 2025.
Direct answer: a 2026 preprint analyzing March 2025 desktop browsing from a representative panel of 900 US adults found that cited-source clicks occurred on 1% of visits in which Google displayed an AI Overview. The same study observed fewer clicks on other results and more search-session endings when an overview appeared.
The result is important, but the denominator and design matter. It is a visit-level observation in one country, one month and one interface period. It is not evidence that every cited source receives a 1% CTR, that later AI Overview designs behave the same way, or that the overview alone caused users to stop searching.
Read the four observed rates together
| Observation | Reported rate | Denominator or comparison |
|---|---|---|
| Searches with an AI Overview | 18% | Observed Google searches in the study |
| Click on a cited AI Overview source | 1% | Visits that displayed an AI Overview |
| Click on another result | 8% with overview; 15% without | Visits separated by overview presence |
| Search session ended | 26% with overview; 16% without | Visits separated by overview presence |
The 1% figure is not the share of visible citations clicked and is not a per-source CTR. A page can be cited alongside several other sources, and the paper reports whether the visit produced a cited-source click.
Understand what the study could observe
The researchers used browser data from a representative panel of 900 US adults and examined Google search-result-page behavior during March 2025. They compared visits with and without an AI Overview and fitted mixed-effects models to account for repeated observations from the same people. The associations remained statistically significant in those models.
This is stronger than an isolated screenshot or a publisher anecdote. It is still observational. Query type, task difficulty, user characteristics and Google’s decision to show an overview may differ between the two groups. The model can adjust for measured structure; it cannot recreate random assignment.
| Supported reading | Unsupported leap |
|---|---|
| AI Overview visits were associated with fewer result clicks in this sample | AI Overviews caused a precise traffic loss for every site |
| Session endings were more common when an overview appeared | Every ending means the user was satisfied |
| Cited-source clicks were rare at the visit level | Citations have no branding or downstream value |
| The pattern survived the authors’ model | The rate is timeless across countries, devices and designs |
Translate the study into publisher measurement
- Keep impression and click denominators separate. Search Console impressions, a page’s total clicks and a cited-source visit rate answer different questions.
- Annotate interface and date. AI Overview layouts and reporting products change; a March 2025 interface is not a permanent control.
- Segment query jobs. Informational, local, commercial and task-completion searches may behave differently.
- Track citations and referrals independently. A cited page can receive no click, and a referral can arrive from an answer surface that a third-party tracker did not observe.
- Measure downstream quality. Engaged sessions, subscriptions, assisted conversions and branded demand can matter even when click volume is small.
The AI impressions versus AI traffic guide shows how to reconcile first-party reporting. For experiment design, use the AEO Experiment Validator and preserve account, locale, device, date and query set.
What to do next
Do not use the paper to forecast a sitewide loss by multiplying every ranking impression by 1%. Instead, build a page-and-query baseline, record the AI feature exposure available to you, and compare page-matched clicks and outcomes over a declared period. Treat citation audits as source-use evidence, not as a substitute for first-party visits.
Limit: this article interprets the authors’ reported results. Search Engine Answer did not reproduce the browsing-panel analysis. The paper is a preprint and may change through review.
Primary documentation
Originally reported 2026-08-16
ChatGPT Outbound Clicks: 5.2% Is Not CTR
Why it matters: A 2026 U.S. desktop study separates ChatGPT’s session-level outbound-click rate from an estimated 9.4% reduction in traditional search use.
Next check: It concerns reduced traditional search use after wider ChatGPT Search access.
Direct answer: a 2026 U.S. desktop clickstream paper reports that ChatGPT produced an outbound click in 5.2% of conversation sessions. It also estimates that wider access to ChatGPT Search reduced traditional search use by 9.4%. The first is a session-level outbound-click rate; the second is a displacement estimate. Neither is a universal ChatGPT CTR.
The study’s bigger point is structural: AI answers can satisfy a task inside the intermediary, while the smaller outbound stream also changes which destinations receive attention.
Keep the two numbers separate
| Number | Denominator or comparison | Interpretation |
|---|---|---|
| 5.2% | Observed ChatGPT conversation sessions | Share producing an outbound click |
| 9.4% | Traditional search use around access expansions | Estimated reduction associated with wider ChatGPT Search access |
A marketing CTR normally divides clicks by impressions or eligible exposures. The paper’s 5.2% divides clicking sessions by conversation sessions. One session can contain multiple turns, no visible source opportunity, or a task that never needed the web. Calling it CTR erases the behavior the researchers measured.
The 9.4% estimate comes from exploiting expansions in ChatGPT Search access. It concerns substitution away from traditional search, with the largest search-referral losses in informational categories. It is not “ChatGPT stole 9.4% of every site’s traffic.”
The outbound stream is different, not only smaller
The authors report that ChatGPT’s remaining clicks skewed toward specialized destinations and away from ad-supported sites. That means a publisher cannot model the channel by shrinking a Google traffic curve. The query mix, source selection, session structure and user motivation differ.
For publishers, the useful questions are page-level:
- Which landing pages actually receive identifiable AI referrals?
- Which topics gain direct, assisted or branded visits?
- Do AI-referred visitors return, subscribe or complete a task?
- Which high-value informational tasks are increasingly satisfied without a click?
- Which pages offer a tool, dataset, workflow or community that an answer cannot contain?
This connects with our AI referral tracking guide: raw channel growth can move while page-level opportunity and causation remain unclear.
Build a publisher measurement stack
- Server requests: preserve referrer, landing URL, timestamp and user agent with privacy controls.
- Analytics sessions: create a transparent channel grouping and keep the raw source/medium.
- Page cohorts: compare exposed topics with similar pages rather than the whole site.
- Outcomes: record newsletter signups, tool use, downloads and return visits.
- Answer observations: save prompts, interface, citations, date and account state separately from referral logs.
Zeros matter. A page can be cited and receive no visit; a page can receive a visit without appearing in your monitored prompt set. Preserve both cases. The AI visibility measurement crosswalk provides a protocol for matching observations to referrals without pretending the sample is complete.
What the paper does not establish
The data is Comscore U.S. desktop URL-level clickstream. Mobile, other countries, later product versions, private browsing and unobserved cross-device behavior can differ. “Conversation session” is a study unit, not a standardized industry impression. The paper does not supply a universal forecast for an individual publisher.
Use the findings as a reason to audit the referral bargain and build first-party value; not as a reason to multiply site traffic by 5.2%.
Primary source
Shi, Zhu and Gu: Answering Without Referring; How AI Search Rewrites the Web’s Economic Bargain.
Status: preprint submitted July 8, 2026. Findings and definitions may change through review.
Originally reported 2026-08-16
AI Overview Click Studies: 1%, 15%, 39.8%
Why it matters: Three prominent 2026 findings use different samples, treatments and outcomes. Here is the denominator-safe comparison.
Next check: Keep unit, treatment, outcome and inference beside the number.
Direct answer: the 1%, 15% and 39.8% findings in recent AI Overview studies are not three estimates of the same metric. About 1% describes visits to an AI Overview in which a cited source was clicked. About 15% estimates a traffic change for matched Wikipedia articles after exposure. The 39.8% result estimates an organic-click reduction when an AI Overview appeared in a randomized browser experiment.
Put them on one chart without the denominator and study design, and the chart becomes misinformation.
Three studies, three questions
| Finding | Design and sample | Outcome | Safe wording |
|---|---|---|---|
| ~1% | One month of browsing data from a representative panel of 900 U.S. adults | Visits to AI Overviews with a click on a cited source | Citation clicks were rare in observed AIO visits |
| ~15% | Difference-in-differences across 161,382 matched Wikipedia article-language pairs | Daily traffic to English Wikipedia articles after AIO exposure | Exposure reduced traffic about 15% in this Wikipedia design |
| 39.8% | Randomized U.S. desktop Chrome field experiment with 1,065 users and 68,089 searches | Organic clicks when an AIO appeared | AIO appearance reduced organic clicking 39.8% in this experiment |
The first paper also reports that AI Overviews are associated with fewer clicks and more session endings after controlling for panelist and query attributes. That remains an observational association. Its 1% figure is not “traffic fell 1%.” It is a citation-click incidence conditional on visiting an AI Overview.
Why the effect sizes diverge
- Different units: people and search visits versus pages and daily traffic.
- Different treatments: seeing an AIO on one results page versus living in a geography where AIOs rolled out.
- Different outcomes: cited-source clicks, all organic clicks or destination-page traffic.
- Different populations: U.S. desktop Chrome users versus Wikipedia language editions and article topics.
- Different counterfactuals: matched unexposed articles, randomized search sessions or statistical controls.
Topic mix also matters. The Wikipedia study found larger relative declines for Culture articles and smaller effects for STEM. A short synthesized response may substitute more fully for one query than another. A publisher’s result depends on query intent, existing rank, AIO prevalence, citation selection and what the page offers beyond the summary.
A denominator checklist for editors
- What exactly is the numerator?
- What population or event is the denominator?
- Is the estimate conditional on an AI Overview appearing?
- Is the outcome a click, a visit, traffic volume or a session ending?
- Was exposure randomized, staggered, observed or inferred?
- What device, country, date range, site type and query mix were included?
- Does the study support causation, association or description?
Do not convert a percentage-point change into a percent change. Do not apply a Wikipedia average to a commerce site. Do not call the 1% citation-click rate a click-through rate unless the paper’s denominator matches the CTR you mean.
Our earlier explainer, What a 900-person AI Overview click study actually found, covers the panel study in detail. The Search Console Generative AI report guide explains why your own impression and page data still cannot be treated as dedicated click attribution.
Sources and limitations
- Chapekis et al.: Investigating Click Behaviors on Google Search Result Pages That Produce an AI Overview
- Khosravi and Yoganarasimhan: Impact of AI Search Summaries on Website Traffic
- Randomized field experiment on AI Overviews and search behavior
Method note: This comparison standardizes the question, unit, treatment, outcome and inference level; it does not pool the estimates. All three are 2026 working papers or preprints and may be revised. The randomized-study details reflect its July 8, 2026 revision.
Translate the result
What an 18.8-point click-through difference means in a planning model
A percentage-point result is easier to use when it is converted into a fixed exposure example.
- Start with 1,000 comparable answer exposures.
- At the observed difference, the lower-click condition would produce 188 fewer publisher visits per 1,000 exposures.
- Keep that figure as a study translation, not a forecast for another site, query mix or interface.
My takeaway: The business question is not whether AI Mode is good or bad in the abstract. It is which query classes lose a meaningful visit and which still create downstream value.
Keep learning
Continue this topic
Next in this topic
Most AI Citation Sources Appeared Once in a 16,069-Citation Sample
Earlier in this topic
What 3,602 Early ChatGPT Ads Reveal About Delivery
Research
Ask a question or join the discussion