
Google AI shopping ad counts need a closer look at the denominator
A retail panel counts sponsored products per answer. Worked examples show how to measure density, coverage and advertiser presence.
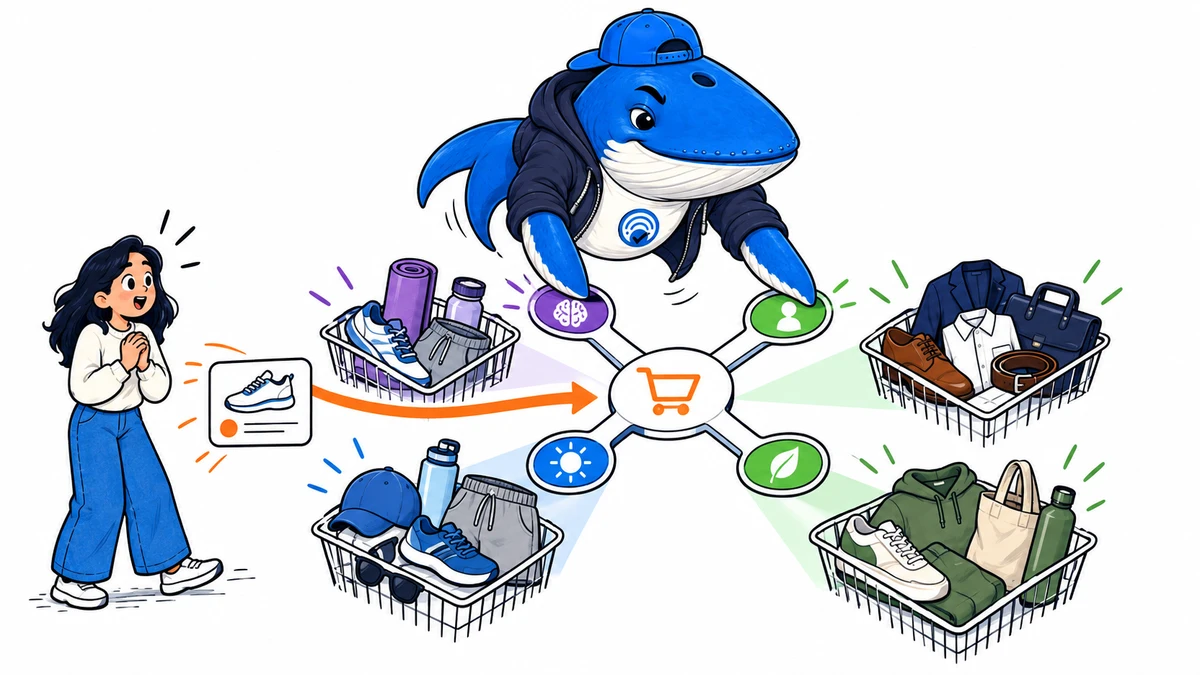
GrowByData’s November 18, 2026 analysis reports sponsored product placements inside Google AI Mode and AI Overviews. Its retail panel follows 140 shopping prompts daily in logged-in U.S. sessions, from July to mid-November. The report counts product ad units, so one answer can contribute multiple units. Original analysis
That counting rule matters when interpreting the headline figures. GrowByData reports 109 units per 100 AI Mode answers in October and 20.5 units per 100 AI Overview answers. These are density measures for the captured answers. An accurate retail report needs additional fields to describe how many answers contained ads, which advertisers appeared, and what happened after a click.
Translate the metric before comparing surfaces
An ad unit is a displayed sponsored product in the panel’s method. An answer is a captured response to a prompt. Dividing units by answers produces average ad density. It does not directly yield the percentage of answers that contain an ad.
For example, suppose 100 captured answers contain 120 product ad units. That is 120 units per 100 answers, or an average of 1.2 units per answer. If all 120 units appeared in 20 six-product carousels, only 20% of the answers contained ads.
The same total could be distributed across more answers. Without the number of answers containing at least one unit, an analyst cannot recover the coverage percentage from the density figure. Keep the original unit label beside every chart.
GrowByData’s findings describe its prompt set, categories, account conditions, and observation period. They give teams a hypothesis to investigate in their own market. The panel does not by itself establish every advertiser’s exposure or a global placement rate.
Define the business question first
A retail team may want to know whether its products appear, whether a competitor appears beside them, or whether its campaigns produce profitable visits. Each question needs a different denominator and evidence source.
For appearance, use captured eligible answers. For competitor co-appearance, specify whether the unit is an answer or a product carousel. For advertising performance, use the platform and analytics reports available to the account, preserving their attribution settings.
Start with one product category and a fixed set of prompts. Include meaningful constraints such as product type, budget, size, or intended use. A generic product query and a detailed shopping request can produce different layouts, so label them in the sample.
Record paid and unpaid appearances independently
For each answer, record the prompt, surface, timestamp, market, language, device, and account state. Save the visible sponsored labels and the full product group before following links. A screenshot cropped around a merchant name may omit the label needed to classify it.
Count the sponsored units, then count unique advertisers. Multiple products from the same merchant can increase its unit count without increasing the number of merchants present. Keep product URLs when available, because repeated variants can also affect inventory.
Record unpaid recommendations and source citations in separate columns. A merchant might have a sponsored product in one section and a source link in another. The two placements may support different customer actions and should remain distinguishable in the report.
An unclear label belongs in an unresolved category until reviewed. Preserve the raw capture and the reviewer’s reason. This is more useful than forcing every item into a paid or unpaid total.
Work through a small example
Imagine a hypothetical set of 50 answers. Fifteen contain sponsored products, and those fifteen contain 45 sponsored units. Your merchant has nine units across six answers. Five of those six answers also include a named competitor.
The sample has 30% ad coverage and 90 units per 100 answers. Your merchant’s unit share is nine divided by 45, or 20%. Its answer presence is six divided by 50, or 12%. The competitor co-appears on five of the six answers containing your merchant.
All four figures accurately describe the same invented sample, but they answer different questions. A dashboard should place the denominator in the label or nearby note. The example is illustrative and is not a new GrowByData result.
If the six merchant appearances produce no measurable clicks, the observation log cannot explain why on its own. Check whether the relevant destinations, campaign reporting, and analytics attribution can be connected before assigning a conversion effect.
Review the destination as well as the placement
Open a small selection of product links in an ordinary customer session. Verify that the displayed product, price, currency, and availability match the landing page. Check variant selection, delivery information, and the ability to reach checkout on mobile.
Use the exact capture time when investigating a price discrepancy. A later stock or price change can explain a mismatch, so preserve both observations. A blocked or broken destination is a concrete issue even when the original appearance was correctly classified.
Fix confirmed feed or landing-page problems through the system that owns the data. Then repeat the same prompts and destination checks. Describe subsequent visibility changes as observations, with campaign and site changes recorded alongside them.
Make the report useful for the next decision
A small repeatable sample can help a team identify recurring product-data errors, classify placements, and ask better questions of its campaign reporting. It needs a stable prompt list, inspectable captures, and explicit missing-data handling.
Use the AI visibility measurement crosswalk to keep source citations and visits distinct. The ChatGPT Wallet merchant guide provides a related method for checking product and checkout handoffs in another AI shopping experience.
Begin with the question your team can act on. If that is landing-page accuracy, inspect destinations. If it is competitor presence, retain the full product group. If it is commercial return, obtain the account-level performance evidence needed to measure it.
Keep learning
Continue this topic
Measure referrals
Set up the GA4 investigation
Check definitions
Keep each visibility event separate
Test the score
Compare visibility with actual visits
Research
Ask a question or join the discussion