Most AI Citation Sources Appeared Once in a 16,069-Citation Sample
A source-long-tail recomputation plus a separate LinkedIn engine-mix example show why aggregate AI citation rankings can hide most domains and platform dependence.
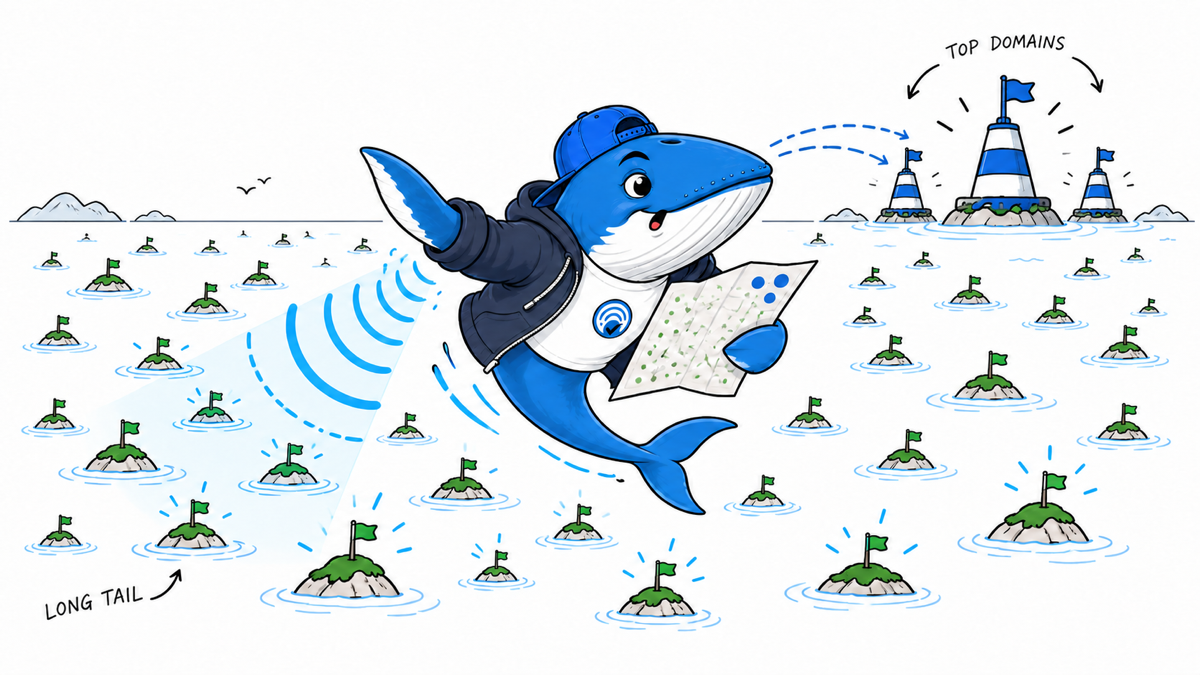
One result changed how I would read any list of the “most cited domains” in AI search: 5,201 of the 7,775 domains in the September Answer Index appeared only once. That is 66.9% of the distinct source domains in a 16,069-citation sample.
The familiar names still matter, but they do not describe the whole source market. The ten most-cited domains accounted for 8.7% of all citation events. The remaining 91.3% was spread across thousands of other domains.
The result in one view
| Answer engine | Citation events | Distinct domains | Domains cited once | Singleton share | Top-10 event share |
|---|---|---|---|---|---|
| ChatGPT | 513 | 368 | 306 | 83.2% | 14.6% |
| Gemini | 5,042 | 3,579 | 2,951 | 82.5% | 5.0% |
| Google AI Overviews | 3,164 | 1,977 | 1,663 | 84.1% | 18.9% |
| Perplexity | 7,350 | 4,788 | 3,919 | 81.9% | 9.0% |
| Combined, deduplicated by domain | 16,069 | 7,775 | 5,201 | 66.9% | 8.7% |
A singleton is a domain with exactly one citation event inside the stated engine or combined sample. The combined percentage is lower because the same domain can appear once in several engines and therefore more than once after the files are pooled.
Download the derived CSV with the counts, formulas, and denominator notes used in this article.
The top ten is a small window
Reddit was the largest source in the pooled file with 573 events, followed by YouTube with 267. Forbes had 111. LinkedIn had 85. NerdWallet had 81. Those are useful observations about this sample, not a universal ranking of source quality.
Together, the ten largest domains generated 1,404 citation events. That sounds substantial until it is placed beside the 14,665 events that pointed somewhere else. A strategy built only from the winners at the top would ignore most of the observed citations and nearly all of the distinct source universe.
Four engines, four different shapes
ChatGPT: the smallest sample
ChatGPT contributed 513 citation events and 368 distinct domains. Its top ten produced 14.6% of citation events, while 83.2% of its distinct domains appeared once. Because this engine was not repeatedly sampled in the release, small count differences should not be treated as stable market shares.
Gemini: the broadest top-level spread
Gemini produced 5,042 events across 3,579 domains. Its top ten accounted for only 5.0% of events, the lowest concentration of the four engine files. That does not prove Gemini is always more diverse. It shows that this particular query and collection design produced a wide source spread.
Google AI Overviews: more concentration at the top
Google AI Overviews produced 3,164 events across 1,977 domains. Its top ten accounted for 18.9% of events, the highest top-ten share in the comparison. Yet 84.1% of its distinct domains were still singletons, so a more concentrated head coexisted with a very long tail.
Perplexity: the largest event file
Perplexity supplied 7,350 events across 4,788 domains. The top ten accounted for 9.0% of events, and 81.9% of distinct domains appeared once. Its larger event count gives the pooled file much of its weight, which is why the engine-level rows should be read before the combined row.
A worked example for publishers
Suppose an AI visibility report says three major platforms dominate the citation list. It is tempting to copy their page formats, pursue mentions on those domains, or conclude that smaller publishers have little chance of appearing.
The long-tail counts support a different first question: which narrow query, claim, or source role caused a one-time domain to be useful? A government definition, a local specialist, a product manual, a research paper, and a first-hand test can each satisfy a different evidence need. Their value disappears when the analysis stops at domain totals.
- Keep the answer engine and collection period separate.
- Group cited URLs by the question they support, not only by domain.
- Inspect singletons for source roles that the top domains do not cover.
- Compare citation presence with mentions, referrals, and outcomes as separate measurements.
- Repeat the same prompt panel before calling a one-time citation a durable pattern.
This is the same denominator discipline used in our audit of 7,473 AI citations and our guide to measuring citations and recommendations separately.
LinkedIn’s rise shows why the engine mix matters
A separate Meltwater report for August 2026 counted about 7.3 million citations across eight AI platforms and thousands of unbranded prompts in seven high-intent consumer categories. LinkedIn reached 100,200 citations, up 24.8% from July, but 69,302 of those citations came from Perplexity.
| Platform | LinkedIn citations | Share of LinkedIn total |
|---|---|---|
| Perplexity | 69,302 | 69.2% |
| Google AI Mode | 13,855 | 13.8% |
| Google AI Overviews | 8,232 | 8.2% |
| Copilot | 3,941 | 3.9% |
| Grok | 3,540 | 3.5% |
| Claude | 699 | 0.7% |
| ChatGPT | 0 | 0% |
| Gemini | 0 | 0% |
Dividing 69,302 by the reported 100,200 total gives 69.2%. That concentration changes the interpretation. “LinkedIn entered the top three” describes the vendor’s aggregate sample. It does not mean every engine increased its use of LinkedIn or that publishing on LinkedIn causes citations.
Meltwater sells the measurement product and publishes aggregate results rather than the underlying rows. Its prompt set, category balance, model versions, geography, and metric definitions shape the counts. The defensible action is to inspect the per-engine mix behind an aggregate visibility number before changing a content strategy.
What this changes in an AEO plan
Do not optimize for a domain leaderboard. A leaderboard describes repeated hosts in a sample. It does not tell you which claim your page must support or whether a source was selected because of authority, specificity, freshness, accessibility, or query fit.
Build inspectable evidence for narrow questions. Clear definitions, original measurements, current documentation, worked examples, and stable author identity give a page a specific reason to be cited. The data does not guarantee that these practices cause citation, but they improve the usefulness a human reviewer can verify.
Measure the head and tail separately. Track repeated domains to understand concentration. Review singletons to discover specialist source roles. If those two groups are combined into one average, the strategy will favor the most visible names and miss the majority pattern.
Keep platform conclusions local. The Reddit citation-share analysis shows why a sharp movement in ChatGPT should not be projected onto Gemini, Perplexity, or Google AI surfaces.
A second study finds a broad tail and a shared head
Prefer’s September 2026 study collected 960 API answers from 80 questions, three runs and four engines. Across 1,329 cited sites, 966 appeared in only one engine. That is 72.7% of the observed domain set.
The distribution changes when frequency is added. Of the 170 sites cited in at least ten answers, 116 appeared in three or four engines and only 14 appeared in one. Prefer also reports that 23 of the top 25 sites appeared across three or four engines.
| Population | One-engine sites | Three- or four-engine sites |
|---|---|---|
| All 1,329 cited sites | 966, or 72.7% | Not reported as a single aggregate in the release |
| 170 sites cited in at least 10 answers | 14, or 8.2% | 116, or 68.2% |
| Top 25 sites | Not reported | 23, or 92% |
This reconciles two apparently conflicting strategies. The complete source universe is highly engine-specific, while the frequently cited head is much more shared. A publisher should inspect narrow source roles in the tail without assuming that every singleton is durable, and audit cross-engine leaders without treating them as the whole market.
The sample was US-English, API-based and concentrated on AI-search topics. It was collected inside one 16-minute window, and the publisher sells AI tracking. Prefer provides aggregate downloads but not the underlying answer rows, so these percentages should not be merged with the Answer Index counts above. Prefer’s methodology and data page.
How the counts were produced
The source is the September 2026 Answer Index, an open dataset released by Hendricks and archived with the DOI 10.5281/zenodo.22242102. The release is licensed under CC BY 4.0.
I counted rows in cite-events.csv by engine and domain. For each engine, the singleton share is domains with one event divided by distinct domains. The top-ten share is citation events from the ten most frequent domains divided by all citation events for that engine. The combined row repeats those calculations after pooling the four engine files and deduplicating domain names.
The dataset is a US-English, API-mediated snapshot dated September 1, 2026. ChatGPT and Gemini were not repeatedly sampled. The Google AI Overviews collection has a documented panel-detection limitation. Citation events do not prove ranking position, source influence, referral traffic, conversion, or causation. The calculations are reproducible from the linked release, but the resulting percentages should not be generalized to every query or user.
The decision
Use top-domain rankings to understand the head of a citation distribution. Use query-level and source-role analysis to understand why the long tail exists. In this sample, the long tail is not a footnote: most distinct domains appeared once, and the top ten captured less than one citation event in eleven.
Keep learning
Continue this topic
Next in this topic
The 16% Synthetic-Source Finding Depends on an AI Detector
Earlier in this topic
Google AI Mode Cut Publisher Click-Through by 18.8 Points in a Field Experiment
Research
Ask a question or join the discussion