

Uptime Kuma
Monitor HTTP responses and page text on important URLs after a release or migration.
Community support
Upvotes come from SearchEngineAnswer members. GitHub stars and reader reviews are counted separately.
Claim this tool if you maintain it.
- Best for
- Site monitoring
- Setup required
- Use Docker and a persistent local volume. Open the dashboard from the same host for the sample setup.
- Costs to check
- The software is open source. Hosting, storage, and some notification services can carry costs.
- License in catalog
- MIT
Project screenshot
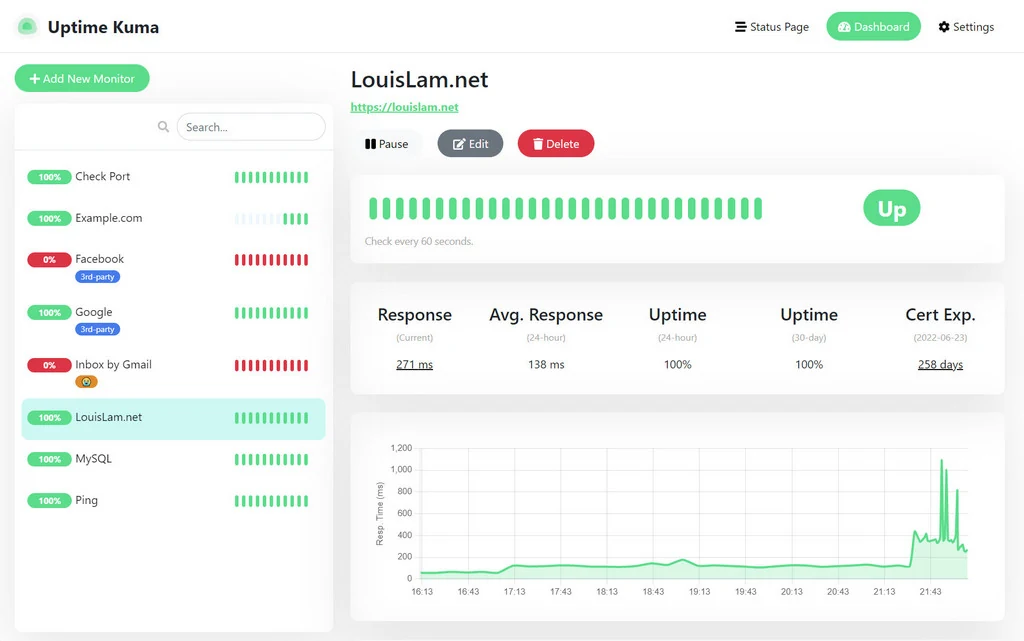
GitHub repository
- GitHub stars
- 93,550
- Forks
- 8,701
- Last push
- 2026-11-12
- Primary language
- JavaScript
GitHub snapshot from . Stars count GitHub bookmarks. Reader ratings appear separately below.
How to install Uptime Kuma
-
Install and start Docker on your monitoring host.
docker run -d --restart=always -p 127.0.0.1:3001:3001 -v uptime-kuma:/app/data --name uptime-kuma louislam/uptime-kuma:2 - Run the container with its persistent volume and local-only port binding. Open http://localhost:3001 and create the initial account.
First tutorial for Uptime Kuma
- Add an HTTP Keyword monitor for a staging article that the monitoring host can reach. Set the keyword to text that should always appear.
- Confirm the monitor reports the page as up. Change the phrase on staging and wait for the next check.
- Restore the original phrase, confirm recovery, and use the event timestamps to compare detection time with your chosen check interval.
Where Uptime Kuma fits
Use Uptime Kuma to check whether important pages respond and still contain expected text after deployment.
- When to choose another tool
- Use a crawl when you need to inspect canonicals, redirects, and status codes across a full site.
- First evaluation
- Add an HTTP Keyword monitor for a staging page that contains a predictable phrase.
- How to interpret the result
- Change the phrase in staging and wait for the monitor to report a failure. Restore it and confirm the check recovers.
Practical workflow
Monitor the URLs readers rely on
Start with a representative article, the newsroom, and the XML sitemap. Use an HTTP monitor for the sitemap and an HTTP Keyword monitor for the article. Pick stable text, such as an article heading you expect to keep, so the monitor can catch an error page that still returns HTTP 200.
Test an alert before a migration
On staging, change the monitored phrase and wait for a failed check. Restore the phrase and confirm recovery. If you enable notifications, verify that both events reach the intended destination and record how long the alert takes.
Place the monitor where it can see outages
Run the monitor outside the site’s hosting environment if you need alerts during a host outage. Use persistent local storage for its data. After a migration, use a crawler or HTTP checks to review redirects, canonicals, and indexing directives alongside the uptime history.
Reviews and discussion
Reader reviews
Be the first to share your experience with this tool.
Discussion
Ask a question or share a setup tip.
Flag an outdated detail
Include the field that needs updating and a source link. Copy your draft, then use the corrections policy to contact the editorial team.
Write a review or join the discussion