

Chrome DevTools MCP
Record Chrome performance traces and inspect rendered pages from an MCP client.
Community support
Upvotes come from SearchEngineAnswer members. GitHub stars and reader reviews are counted separately.
Claim this tool if you maintain it.
- Best for
- MCP servers
- Setup required
Use a supported Node.js LTS release, npm, a current stable Chrome release, and an MCP client.
- Costs to check
The server is open source. Local Chrome runs use your machine’s resources.
- License in catalog
- Apache-2.0
Project screenshot
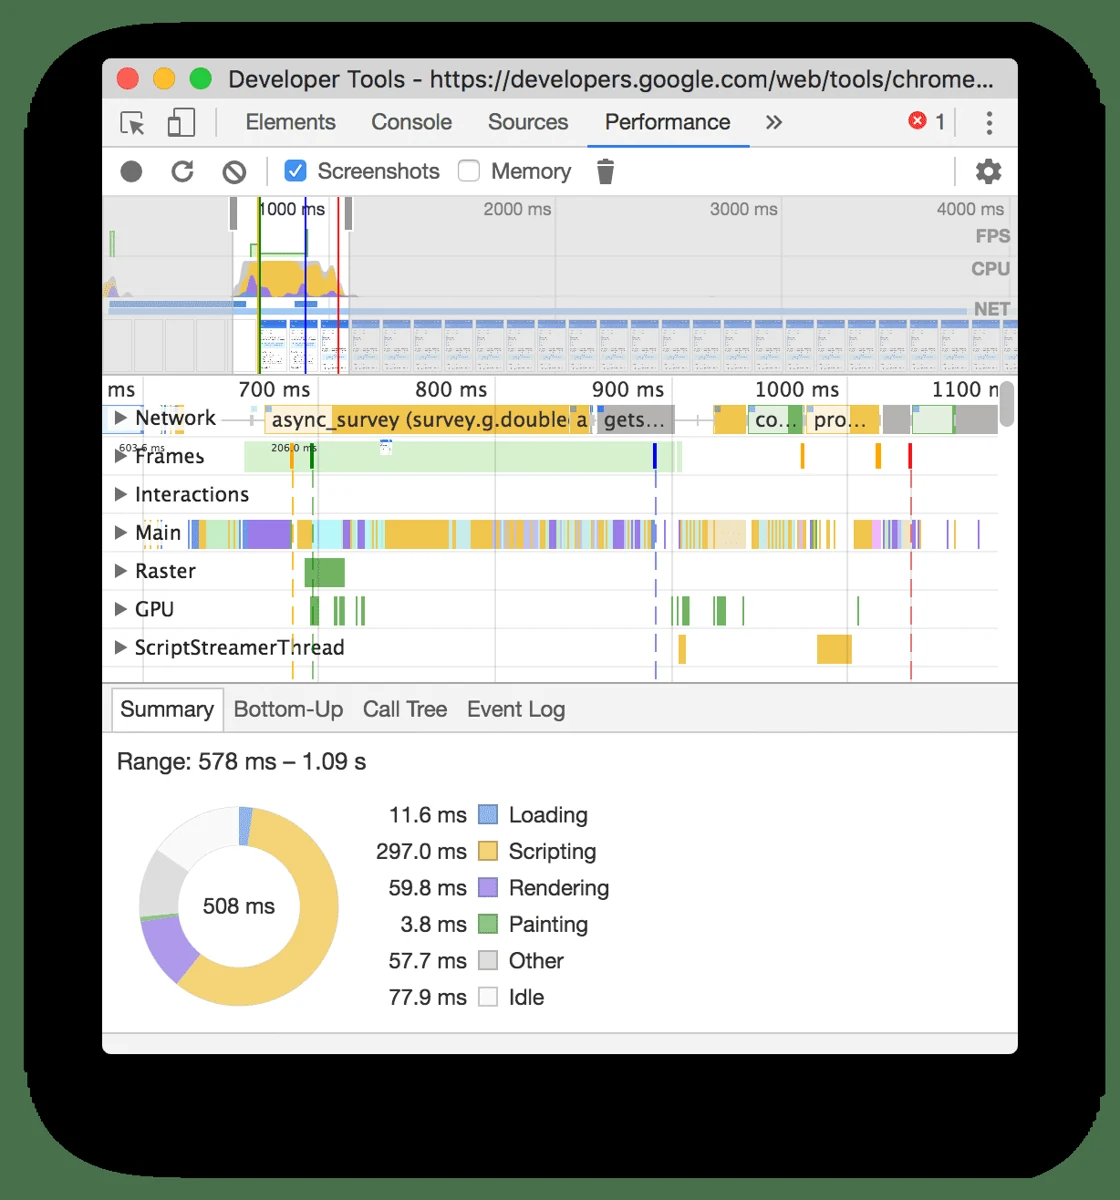
GitHub repository
- GitHub stars
- 55,152
- Forks
- 4,593
- Last push
- 2026-11-12
- Primary language
- TypeScript
GitHub snapshot from . Stars count GitHub bookmarks. Reader ratings appear separately below.
How to install Chrome DevTools MCP
-
Install Node.js LTS and Chrome, then confirm that npm is available.
npx -y chrome-devtools-mcp@latest - Add the server to your MCP client. Use npx as the command, and -y and chrome-devtools-mcp@latest as its two arguments. Reload the client.
First tutorial for Chrome DevTools MCP
- Ask the client to record a performance trace for a public staging article you manage.
- Inspect the trace for the Largest Contentful Paint element and check when its resource request started.
- Make one change on staging, record the same page again, and compare the traces under equivalent conditions.
Where Chrome DevTools MCP fits
Use this server when an agent needs browser evidence to investigate a slow article or landing page.
- When to choose another tool
Use Chrome DevTools directly when you want to inspect a single trace interactively.
- First evaluation
Record a page-load trace on a staging article and locate the Largest Contentful Paint element.
- How to interpret the result
Check the underlying trace and network timing before changing the page. Repeat the trace under the same conditions to assess a change.
Practical workflow
Diagnose a slow article template
Record a trace for a public staging article with Chrome DevTools MCP. Identify the Largest Contentful Paint element and trace its request back to the page. For an image, note when Chrome discovered the request and when the resource finished loading. If the element appears well after its resource finishes, inspect rendering work before changing image compression.
Make two traces comparable
Use the same URL, browser version, viewport, throttling settings, and cache state. Change one thing at a time. Save the trace or capture its findings so another person can verify which element changed. A staging trace measures one browser run. Use field data to assess how readers experience the production site.
Keep browser sessions separate
Use a dedicated Chrome profile for agent-driven checks. Record public or staging pages unless your workflow calls for authenticated access. An MCP client connected to a browser session can inspect content available in that session.
Reviews and discussion
Reader reviews
Be the first to share your experience with this tool.
Discussion
Ask a question or share a setup tip.
Flag an outdated detail
Include the field that needs updating and a source link. Copy your draft, then use the corrections policy to contact the editorial team.
Write a review or join the discussion