Organic Clicks Up, Sales Down: Diagnose the Gap
Reconcile Search Console clicks, GA4 sessions, funnel events and backend outcomes to find why organic traffic rose while sales fell.
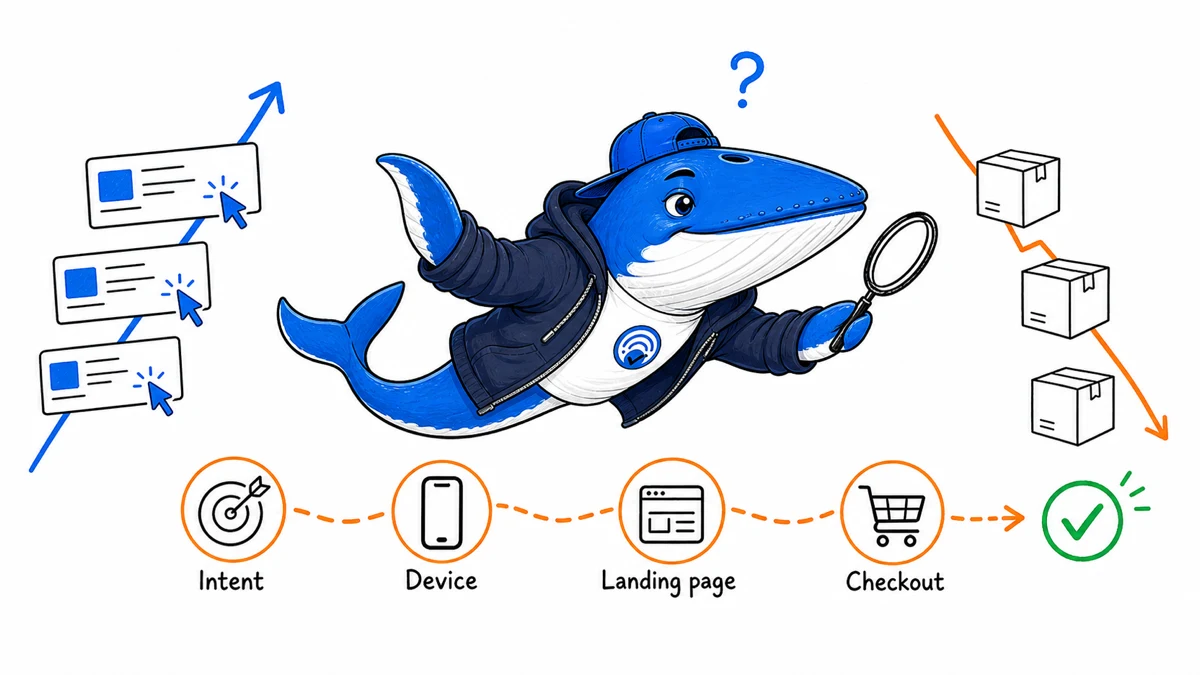
Direct answer: when organic clicks rise while sales fall, first reconcile the measurement chain: Search Console click, landed session, product or lead view, primary action, checkout or form start, analytics completion, accepted backend outcome and net revenue. The largest verified break determines the next test.
Do not divide Search Console clicks by GA4 purchases and call the result an organic conversion rate. Those systems observe different events, on different scopes, with different collection limits. Use the downloadable ledger below to preserve each layer and the evidence that supports it.
Keep acquisition, behavior and business outcomes separate
| Layer | Observation | Best source | What it does not prove |
|---|---|---|---|
| Search exposure | Impressions, clicks, queries, pages, country, device | Search Console | A click became a measured session or buyer |
| Landing | Organic session reached a page | GA4 plus server request logs | The visitor saw a product or qualified offer |
| Engagement | Product view, form view, internal action | GA4 events or product analytics | The event is implemented completely or uniquely |
| Intent | Add to cart, form start, begin checkout | GA4 and application events | The transaction succeeded |
| Analytics completion | Purchase or submission event | GA4 | The order was accepted, paid or retained |
| Business outcome | Accepted order/lead and net revenue | Commerce, payment or CRM system | Organic search deserves all causal credit |
Google Analytics documents Traffic acquisition as session-scoped. It also notes that ecommerce actions such as product views, add-to-cart and purchases are not collected automatically; they require an ecommerce implementation. A chart can therefore show a real traffic increase beside an artificial sales decline if a purchase tag broke, and it can show stable analytics revenue while backend refunds or rejected leads worsened.
Align scope before calculating a gap
Use the same date range, reporting time zone, hostname, country, device and landing-page scope. Record the Search Console property type and filters. In GA4, use session-scoped source dimensions for Traffic acquisition and filter by landing or page scope intentionally. In the backend, define whether the outcome is submitted, accepted, paid, fulfilled, refunded or net.
Then calculate diagnostic ratios without pretending they are identical metrics:
- Session match rate = GA4 organic sessions ÷ Search Console clicks.
- Landing-to-action rate = primary action starts ÷ landed sessions.
- Action-to-checkout rate = checkout or form starts ÷ primary action starts.
- Analytics completion rate = GA4 purchases or submissions ÷ checkout or form starts.
- Backend acceptance rate = accepted orders or leads ÷ GA4 completions.
- Net value per accepted outcome = backend net revenue ÷ accepted outcomes.
The session match rate is a reconciliation signal, not a universal target. Consent, tag loading, redirects, browser behavior, attribution and session rules can all affect it. Establish the site’s normal range by segment and investigate changes against that baseline.
Build the baseline from comparable operating periods, not a single previous week. Mark promotions, outages, tracking releases, stock changes and holidays. Use both the median transition rate and the raw count so one unusually large or small day does not become the standard. If the business is seasonal, compare the same season and preserve a recent control period. A useful alert states the expected range, the observed value, the sample size and the first date the divergence became material.
Worked example: find the largest break
The following values are illustrative; they are not SearchEngineAnswer or client performance data. Suppose a mobile, US, non-brand commercial landing-page group records 1,000 Search Console clicks, 800 GA4 organic sessions, 400 product views, 160 add-to-cart events, 120 checkout starts, 72 GA4 purchases and 68 accepted backend orders with $6,800 net revenue.
| Transition | Calculation | Rate | Question |
|---|---|---|---|
| Click → session | 800 ÷ 1,000 | 80% | Did consent, loading or redirects change? |
| Session → product view | 400 ÷ 800 | 50% | Did the landing mix become more informational? |
| Product view → add to cart | 160 ÷ 400 | 40% | Did price, stock or product fit change? |
| Add to cart → checkout | 120 ÷ 160 | 75% | Is the cart blocking a segment? |
| Checkout → GA4 purchase | 72 ÷ 120 | 60% | Did checkout, payment or purchase tracking fail? |
| GA4 purchase → accepted order | 68 ÷ 72 | 94.4% | Are duplicates, cancellations or rejection rising? |
Now compare those rates with the prior period for the same segment. If click-to-session fell from its normal 95% to 80% while later stages stayed stable, the first investigation belongs at landing delivery and measurement. If session matching stayed stable but checkout completion collapsed, rewriting search content is unlikely to be the fastest fix.
Download the organic search-to-sales reconciliation ledger (CSV). It includes the illustrative row, formulas, evidence fields, known limits, owner, next test and stop rule.
Validate measurement before traffic quality
- Open representative organic landing URLs with realistic parameters and confirm redirects preserve the final destination.
- Verify the analytics tag and consent behavior on the final page across priority browsers and devices.
- Trigger each funnel event once and inspect its name, timestamp, page, item data, currency, value and transaction identifier.
- Compare GA4 purchases or submissions with backend records by transaction or lead identifier where privacy and system design allow.
- Check release notes for consent, tag-manager, checkout, payment, cross-domain, channel-group or attribution changes.
If backend orders are healthy but analytics purchases fell, the commercial system did not fail. Repair collection and annotate the affected period. If both sources fell at the same stage, continue into demand and funnel diagnosis.
Test whether the click mix changed
Split branded and non-branded queries, then group intent into informational, comparison, category, product, support and navigational jobs. Compare country, device and landing page. More clicks can arrive from a new low-intent guide, from countries the business cannot serve or from mobile results whose landing experience is weak.
| Shift | Check next | Do not conclude yet |
|---|---|---|
| Clicks moved to guides | Internal product clicks, assisted paths, query intent | Informational traffic has no value |
| A new country grew | Shipping, language, currency, stock and eligibility | Core-market rankings improved |
| Mobile grew fastest | Viewport, speed, form, payment and browser errors | Mobile users never buy |
| Product-page clicks grew | Price, inventory, variants, reviews and delivery promise | The SEO content is working commercially |
| Clicks grew but server landings did not | Redirects, outages, bot/security rules and logs | Search Console data is wrong |
Search Console clicks describe interactions in Google Search. They do not classify the visitor as qualified. Keep the query group connected to the landing page and business eligibility rather than using a sitewide click total as a proxy for demand.
Locate the commercial break
For ecommerce, compare view item, add to cart, begin checkout, shipping or payment steps, purchase, backend acceptance, refund and net revenue. For lead generation, compare form view, start, validation error, submission, CRM acceptance, qualification and close.
Inspect raw counts and transition rates. A rate can fall while the count of accepted outcomes rises; a rate can rise because the denominator lost valid traffic. Check both. Segment the break by product, stock state, price band, promotion, browser, payment method, shipping region and new versus returning visitor.
When a specific transition deteriorates, list mechanisms that can affect that transition. For checkout completion: payment outage, unavailable method, shipping surprise, browser error, coupon failure, login requirement or purchase-event failure. Rank those mechanisms by direct evidence, not by which team owns them.
Use attribution without turning it into causality
A visitor may discover a product in organic search and return through email, paid search, direct navigation or an app. GA4’s user-acquisition and traffic-acquisition reports use different scopes, and its attribution settings can distribute credit for key events. Backend systems may use yet another rule.
Report the observations plainly: organic search produced a measured landing session; a later event received a configured attribution credit; the backend accepted an order. Do not describe the assigned channel as the only cause unless the study design supports that claim.
Choose one bounded test and a stop rule
- Identify the largest verified change in a transition rate or outcome count.
- Name one mechanism that can produce that change.
- Choose the smallest affected segment where the mechanism can be tested.
- Define the release time, observation window, success metric and guardrail.
- Write a stop rule before changing anything.
- Preserve null and negative results in the ledger.
Example: “On mobile Safari for UK product landings, purchase-event completions fell after the checkout release while backend accepted orders did not. Restore the transaction identifier in the analytics payload. Stop after 100 accepted orders or seven days; success is purchase-to-backend reconciliation returning to the pre-release range without duplicate transactions.”
That is more useful than “improve conversion rate” because it names the segment, evidence, mechanism, change and stopping condition.
Limits of the workflow
The ledger does not create causal proof and cannot recover data that was never collected. Small segments can be noisy, consent can make some visitors unobservable in analytics, and backend definitions vary. Use ranges and confidence appropriate to the sample, preserve system definitions and avoid combining currencies or order states without an explicit rule.
Funnel math
Diagnose the gap with 1,000 organic sessions
A fixed-session model exposes where revenue changed without assuming that rankings are the cause.
- At a 3% lead rate, 1,000 sessions produce 30 leads.
- If the lead rate falls to 2%, the same traffic produces 20 leads.
- If lead quality or close rate also falls, sales can decline while clicks rise.
My takeaway: I start with landing-page mix, conversion rate, offer availability and measurement integrity before treating a traffic increase as a successful SEO outcome.
Primary documentation
Keep learning
Ask a question or join the discussion