AI Overview Studies Report 1%, 15% and 39.8%—They Measure Different Things
Three prominent 2026 findings use different samples, treatments and outcomes. Here is the denominator-safe comparison.
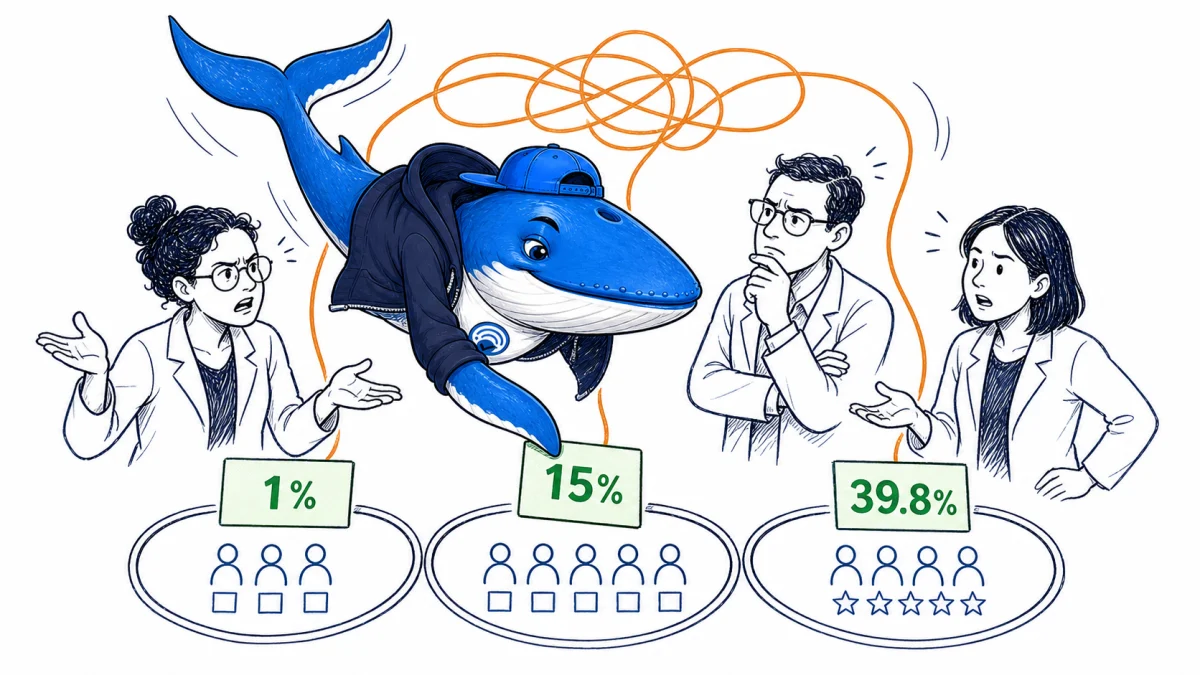
Direct answer: the 1%, 15% and 39.8% findings in recent AI Overview studies are not three estimates of the same metric. About 1% describes visits to an AI Overview in which a cited source was clicked. About 15% estimates a traffic change for matched Wikipedia articles after exposure. The 39.8% result estimates an organic-click reduction when an AI Overview appeared in a randomized browser experiment.
Put them on one chart without the denominator and study design, and the chart becomes misinformation.
Three studies, three questions
| Finding | Design and sample | Outcome | Safe wording |
|---|---|---|---|
| ~1% | One month of browsing data from a representative panel of 900 U.S. adults | Visits to AI Overviews with a click on a cited source | Citation clicks were rare in observed AIO visits |
| ~15% | Difference-in-differences across 161,382 matched Wikipedia article-language pairs | Daily traffic to English Wikipedia articles after AIO exposure | Exposure reduced traffic about 15% in this Wikipedia design |
| 39.8% | Randomized U.S. desktop Chrome field experiment with 1,065 users and 68,089 searches | Organic clicks when an AIO appeared | AIO appearance reduced organic clicking 39.8% in this experiment |
The first paper also reports that AI Overviews are associated with fewer clicks and more session endings after controlling for panelist and query attributes. That remains an observational association. Its 1% figure is not “traffic fell 1%.” It is a citation-click incidence conditional on visiting an AI Overview.
Why the effect sizes diverge
- Different units: people and search visits versus pages and daily traffic.
- Different treatments: seeing an AIO on one results page versus living in a geography where AIOs rolled out.
- Different outcomes: cited-source clicks, all organic clicks or destination-page traffic.
- Different populations: U.S. desktop Chrome users versus Wikipedia language editions and article topics.
- Different counterfactuals: matched unexposed articles, randomized search sessions or statistical controls.
Topic mix also matters. The Wikipedia study found larger relative declines for Culture articles and smaller effects for STEM. A short synthesized response may substitute more fully for one query than another. A publisher’s result depends on query intent, existing rank, AIO prevalence, citation selection and what the page offers beyond the summary.
A denominator checklist for editors
- What exactly is the numerator?
- What population or event is the denominator?
- Is the estimate conditional on an AI Overview appearing?
- Is the outcome a click, a visit, traffic volume or a session ending?
- Was exposure randomized, staggered, observed or inferred?
- What device, country, date range, site type and query mix were included?
- Does the study support causation, association or description?
Do not convert a percentage-point change into a percent change. Do not apply a Wikipedia average to a commerce site. Do not call the 1% citation-click rate a click-through rate unless the paper’s denominator matches the CTR you mean.
Our earlier explainer, What a 900-person AI Overview click study actually found, covers the panel study in detail. The Search Console Generative AI report guide explains why your own impression and page data still cannot be treated as dedicated click attribution.
Sources and limitations
- Chapekis et al.: Investigating Click Behaviors on Google Search Result Pages That Produce an AI Overview
- Khosravi and Yoganarasimhan: Impact of AI Search Summaries on Website Traffic
- Randomized field experiment on AI Overviews and search behavior
Method note: This comparison standardizes the question, unit, treatment, outcome and inference level; it does not pool the estimates. All three are 2026 working papers or preprints and may be revised. The randomized-study details reflect its July 8, 2026 revision.
Ask a question or join the discussion