Only 1% Click AI Overview Sources? What a 900-Person Study Actually Shows
A 900-person US browsing study observed fewer result clicks and more session endings when AI Overviews appeared. Here is the denominator, study design, and limit behind the 1% source-click figure.
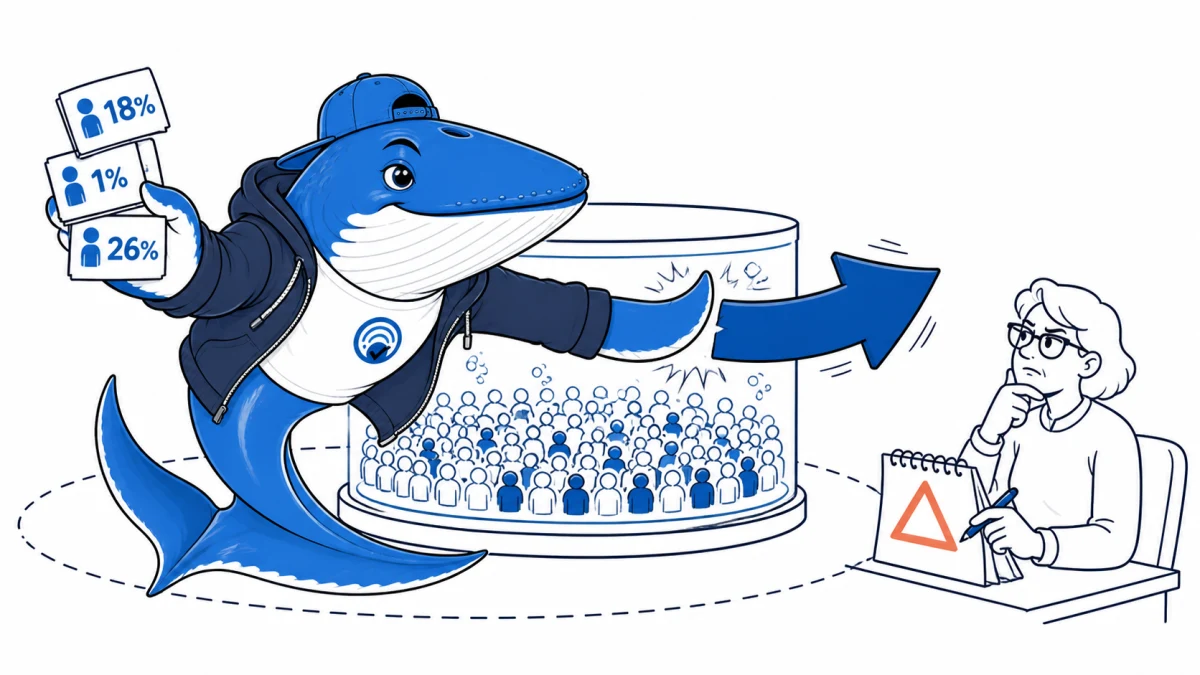
Direct answer: a 2026 preprint analyzing March 2025 desktop browsing from a representative panel of 900 US adults found that cited-source clicks occurred on 1% of visits in which Google displayed an AI Overview. The same study observed fewer clicks on other results and more search-session endings when an overview appeared.
The result is important, but the denominator and design matter. It is a visit-level observation in one country, one month and one interface period. It is not evidence that every cited source receives a 1% CTR, that later AI Overview designs behave the same way, or that the overview alone caused users to stop searching.
Read the four observed rates together
| Observation | Reported rate | Denominator or comparison |
|---|---|---|
| Searches with an AI Overview | 18% | Observed Google searches in the study |
| Click on a cited AI Overview source | 1% | Visits that displayed an AI Overview |
| Click on another result | 8% with overview; 15% without | Visits separated by overview presence |
| Search session ended | 26% with overview; 16% without | Visits separated by overview presence |
The 1% figure is not the share of visible citations clicked and is not a per-source CTR. A page can be cited alongside several other sources, and the paper reports whether the visit produced a cited-source click.
Understand what the study could observe
The researchers used browser data from a representative panel of 900 US adults and examined Google search-result-page behavior during March 2025. They compared visits with and without an AI Overview and fitted mixed-effects models to account for repeated observations from the same people. The associations remained statistically significant in those models.
This is stronger than an isolated screenshot or a publisher anecdote. It is still observational. Query type, task difficulty, user characteristics and Google’s decision to show an overview may differ between the two groups. The model can adjust for measured structure; it cannot recreate random assignment.
| Supported reading | Unsupported leap |
|---|---|
| AI Overview visits were associated with fewer result clicks in this sample | AI Overviews caused a precise traffic loss for every site |
| Session endings were more common when an overview appeared | Every ending means the user was satisfied |
| Cited-source clicks were rare at the visit level | Citations have no branding or downstream value |
| The pattern survived the authors’ model | The rate is timeless across countries, devices and designs |
Translate the study into publisher measurement
- Keep impression and click denominators separate. Search Console impressions, a page’s total clicks and a cited-source visit rate answer different questions.
- Annotate interface and date. AI Overview layouts and reporting products change; a March 2025 interface is not a permanent control.
- Segment query jobs. Informational, local, commercial and task-completion searches may behave differently.
- Track citations and referrals independently. A cited page can receive no click, and a referral can arrive from an answer surface that a third-party tracker did not observe.
- Measure downstream quality. Engaged sessions, subscriptions, assisted conversions and branded demand can matter even when click volume is small.
The AI impressions versus AI traffic guide shows how to reconcile first-party reporting. For experiment design, use the AEO Experiment Validator and preserve account, locale, device, date and query set.
What to do next
Do not use the paper to forecast a sitewide loss by multiplying every ranking impression by 1%. Instead, build a page-and-query baseline, record the AI feature exposure available to you, and compare page-matched clicks and outcomes over a declared period. Treat citation audits as source-use evidence, not as a substitute for first-party visits.
Limit: this article interprets the authors’ reported results. Search Engine Answer did not reproduce the browsing-panel analysis. The paper is a preprint and may change through review.
Ask a question or join the discussion